This text was originally written for an internal talk. Some time later I decided to publish it as my first post.
Introduction
There are quite a few logging libraries out there — NLog, Serilog, Log4net, ELMAH, and so on — but this post focuses on Microsoft.Extensions.Logging, the built-in option, because its capabilities are generally sufficient.
I also want to encourage everyone to write logs in general. You don't have to log every action and every line of code, but errors, unexpected behavior, and the main actions of your business logic are worth recording. Logs aren't only useful to you, the service developers — they also help:
- other developers understand "what's actually happening in that service"
- testers write more accurate bug reports (it's much easier when someone brings a link to a log than an abstract "when I click the button it breaks")
- support teams diagnose errors and incidents
Log Levels
Why does this even matter?
- If you write everything (both important and technical messages) at, say,
Information, sifting through that pile later becomes a nightmare. - Without proper levels you lose the ability to filter logs meaningfully before shipping them to Elasticsearch in production.
| Level | Description |
|---|---|
| Trace | The lowest level — tracks every event that occurs |
| Debug | Messages useful for understanding application behavior |
| Information | Main application messages |
| Warning | Situations that theoretically shouldn't happen but are handled correctly |
| Error | Non-critical errors that weren't anticipated |
| Critical | Fatal errors after which the application cannot continue |
| None | Used only in filters to disable logging entirely |
Error Handling
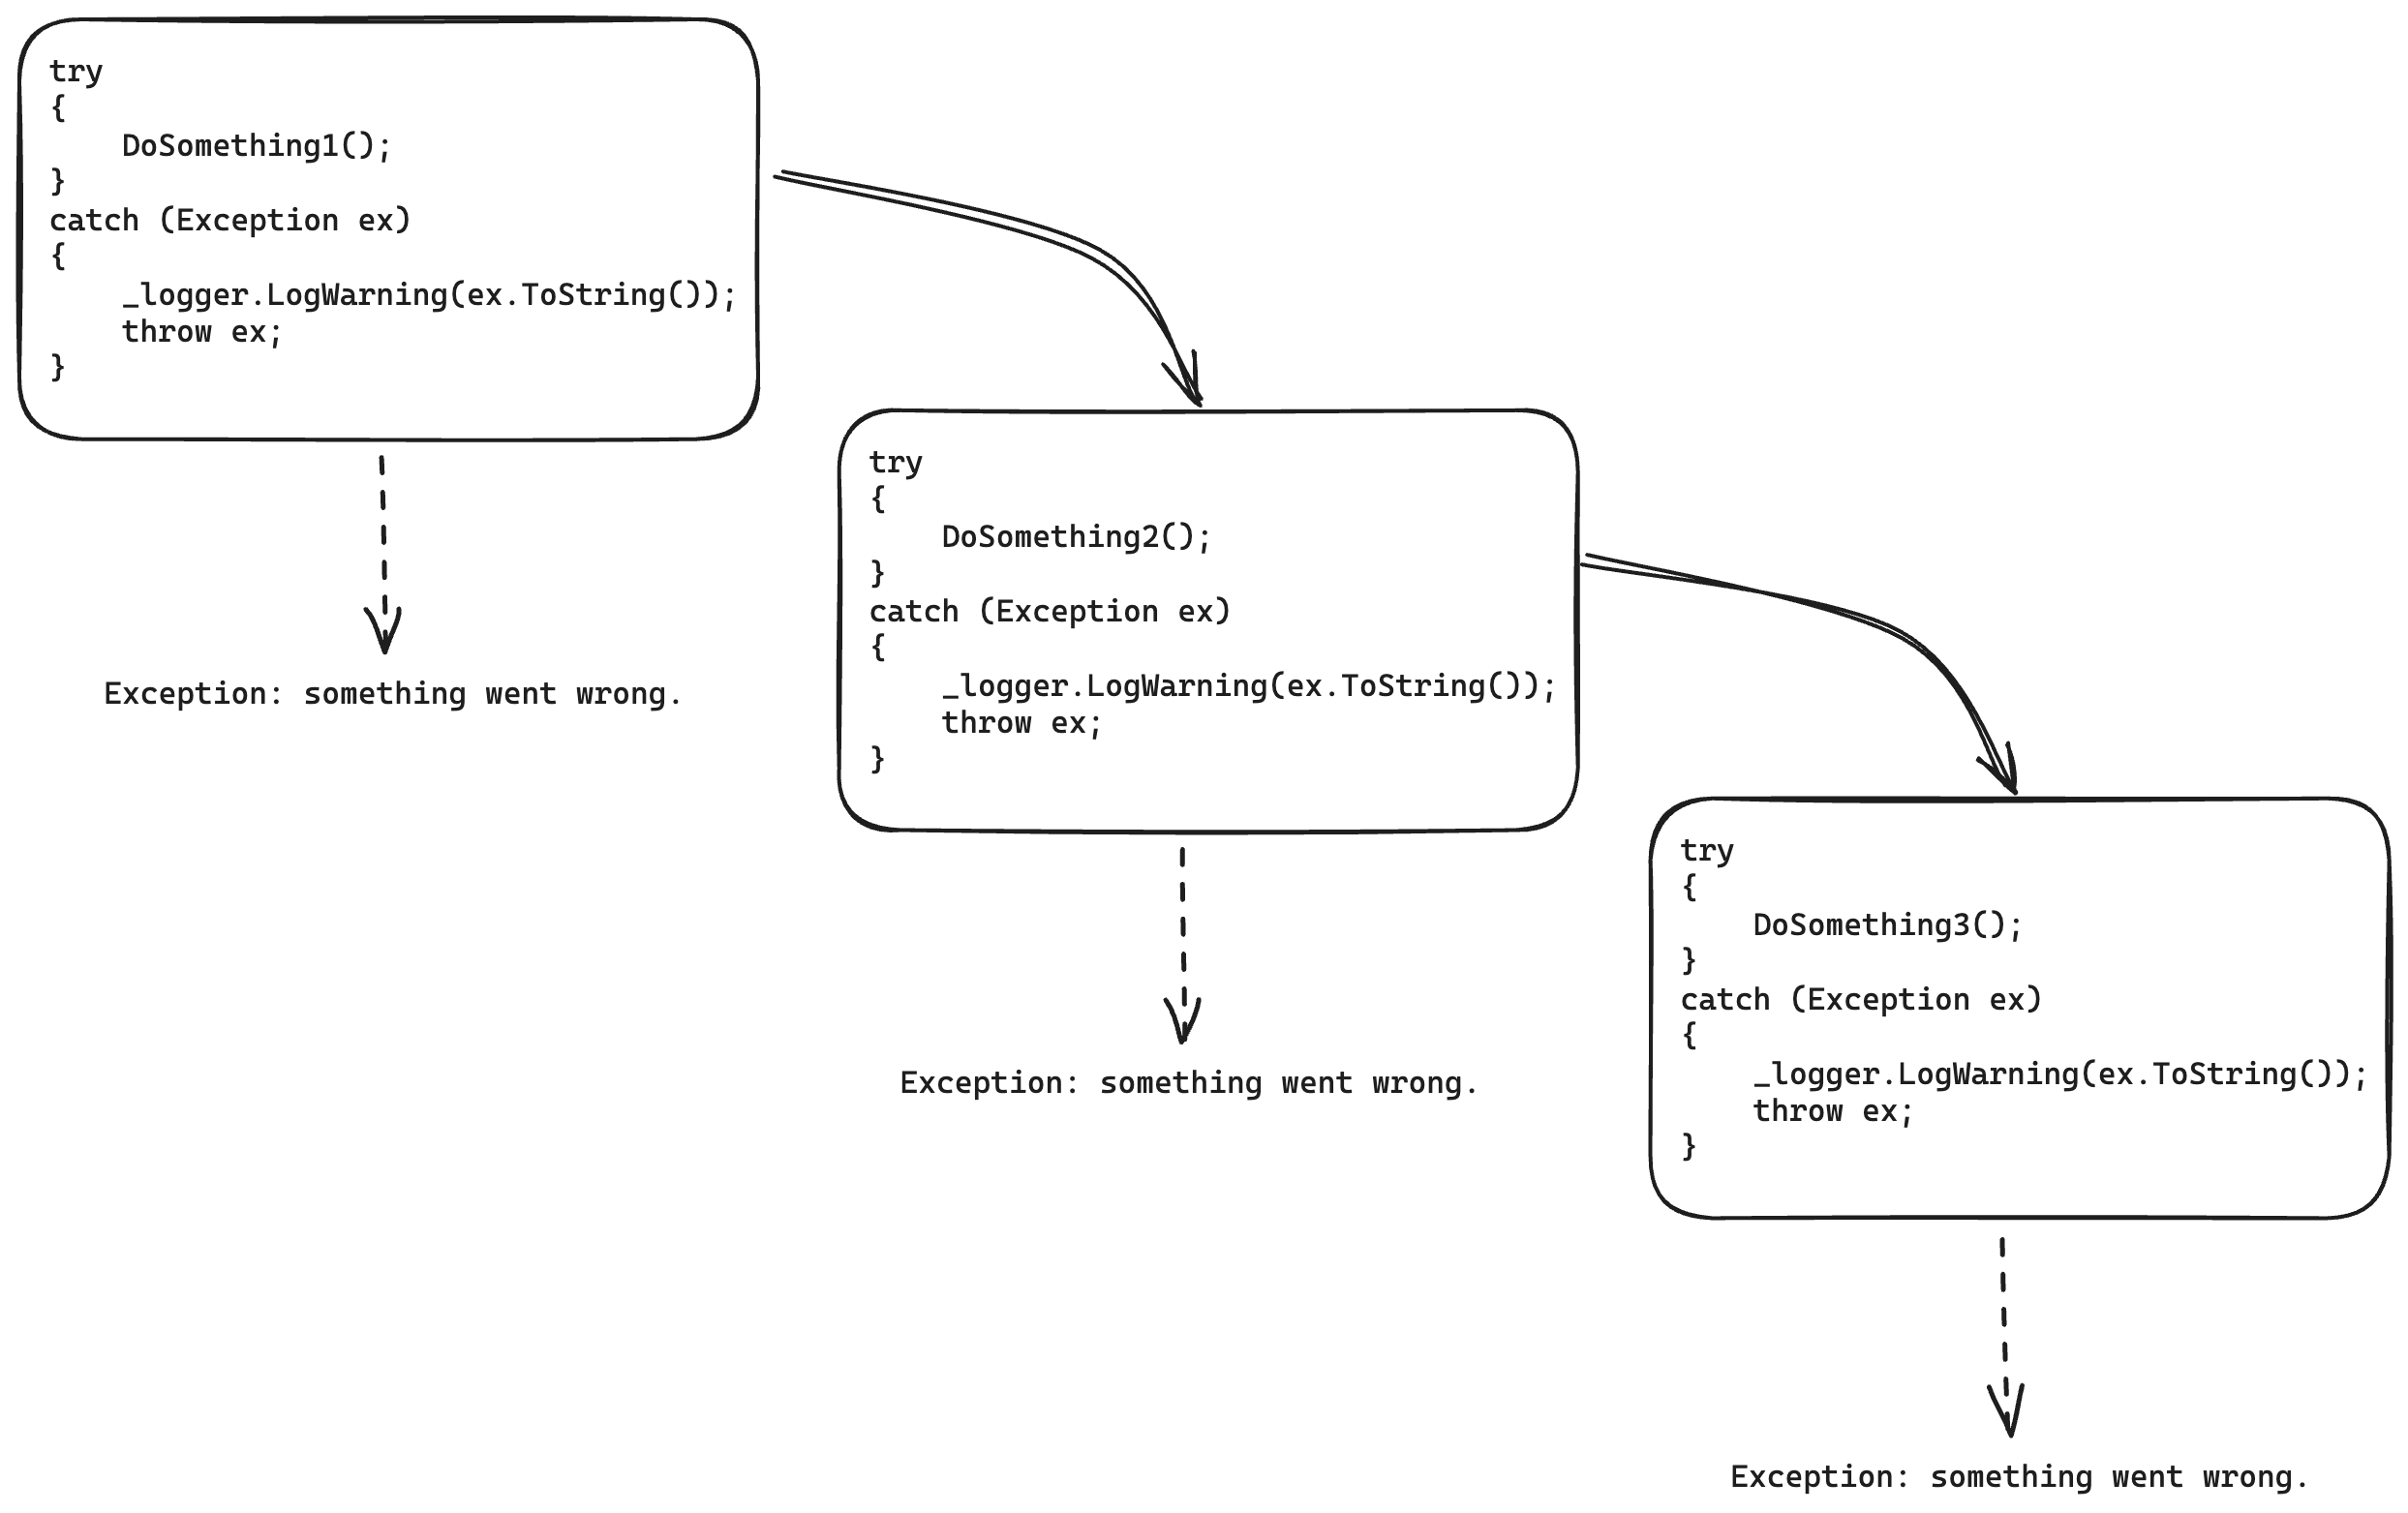
Before talking about what to log, I think it's worth discussing error handling. While digging into the BEAM VM and Erlang I came across the interesting "let it fail" principle: don't catch an exception if you're not going to do anything with it — let it propagate up to the handler that expects it. A pattern you'll often see:
try
{
    DoSomething();
}
catch (Exception ex)
{
    _logger.LogWarning(ex.ToString());
    throw ex;
}
What's the problem?
- It clutters methods with essentially useless code that hurts readability.
- Re-throwing with
throw exloses the original stack trace. - When calling a method that throws, can you tell — without looking inside — whether it already logged the exception? You can end up with multiple log entries for the same exception.
What to do instead
If you're not going to handle the exception, don't catch it. Don't turn this into Go-style infinite error bubbling. But do make sure it will be caught somewhere — for example by a global handler such as IExceptionFilter.
It's also worth distinguishing between system errors and domain errors. Not every error should return 500 Internal Server Error. Take this example: a user wants to add a pet, but the nickname is already taken.
First, create a root exception type for domain errors:
public abstract class DomainException(string message, Exception? innerException = null)
    : Exception(message, innerException)
{
    public abstract string ERROR_CODE { get; }

    public virtual ProblemDetails GetProblemDetails() => new()
    {
        Title = ERROR_CODE,
        Detail = message,
        Status = (int)HttpStatusCode.UnprocessableEntity
    };
}
Then a concrete type with a meaningful error message:
public class NickTakenException(string nickName, Exception? innerException = null)
    : DomainException($"Nick {nickName} already taken", innerException)
{
    public override string ERROR_CODE => "NICKNAME_TAKEN";
}
Wrap the infrastructure exception in the domain one:
try
{
    await _petsRepository.Create(pet);
}
catch (UniqueConstraintException ex)
{
    throw new NickTakenException(pet.NickName, ex);
}
And in the global handler, split the logic for domain vs. other exceptions:
public class ExceptionFilter(ILogger<ExceptionFilter> logger) : IEndpointFilter
{
    public async ValueTask<object?> InvokeAsync(
        EndpointFilterInvocationContext context,
        EndpointFilterDelegate next)
    {
        try
        {
            return await next(context);
        }
        catch (DomainException e)
        {
            logger.LogInformation(
                eventId: ApplicationEventId.UnprocessibleRequest,
                message: "Cannot process request due to domain exception: {exception}",
                e.Message);

            return TypedResults.Problem(e.GetProblemDetails());
        }
        catch (Exception e)
        {
            logger.LogError(
                eventId: ApplicationEventId.RequestFailed,
                exception: e,
                message: "Request failed"
            );

            throw;
        }
    }
}
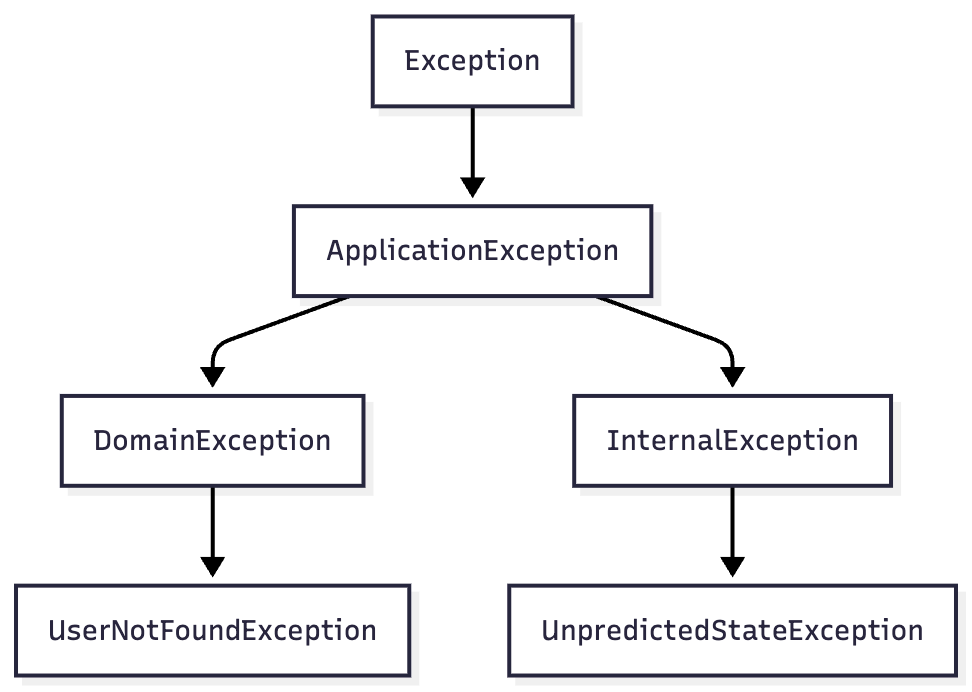
The resulting exception hierarchy:
What to log
- Exceptions — we've covered which ones and how.
- Domain events (data mutations, user actions).
- Technical data for potential debugging (at
LogLevel.DebugorLogLevel.Trace). Overly verbose logging in production will slow down both the application and Elasticsearch.
Log Format
Flat logging
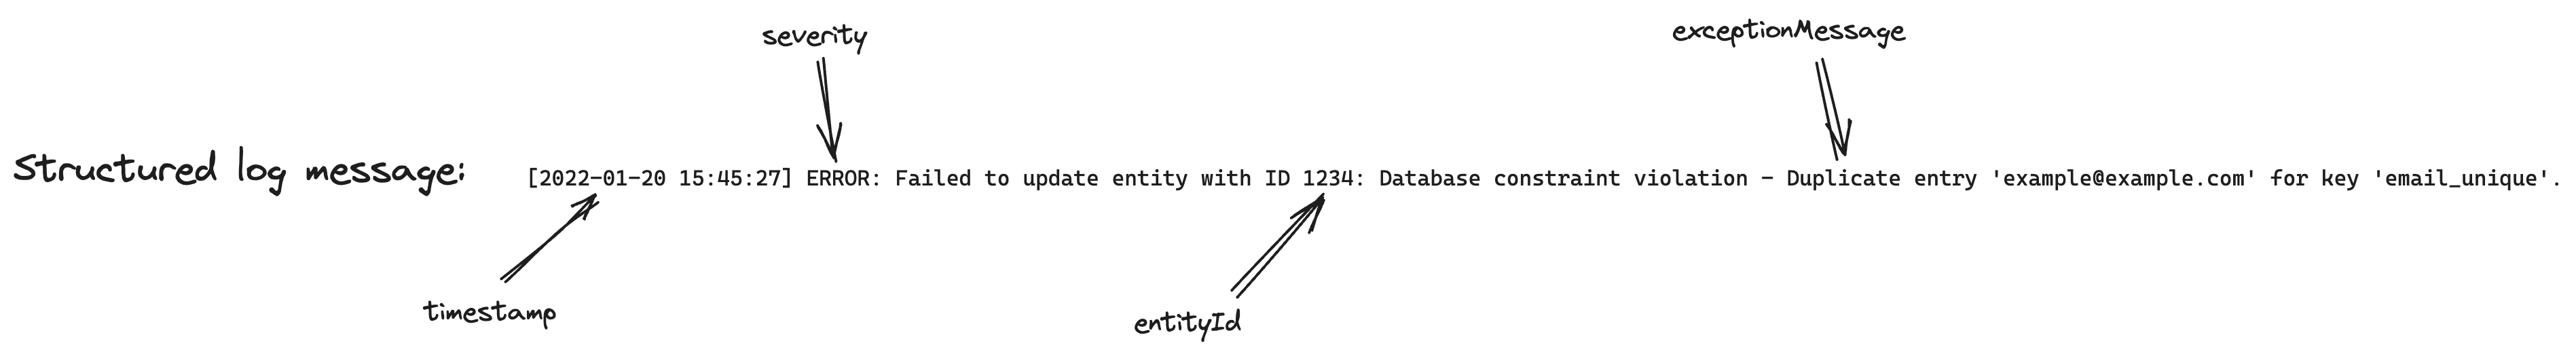
Historically, logs were just plain text messages written to a file or stdout. This causes a familiar problem. Suppose you have a message like:
[2022-01-20 15:45:27] ERROR: Failed to update entity with ID 1234: Database constraint violation - Duplicate entry '[email protected]' for key 'email_unique'.
You want to find all errors related to the entity with ID 1234:
$ cat test.log | grep 'ERROR' | grep 'ID 1234'
[2022-01-20 15:45:27] ERROR: Failed to update entity with ID 1234: Database constraint violation - Duplicate entry '[email protected]' for key 'email_unique'.
But the log file also contained this line, which the grep missed because the format is slightly different:
[2022-01-20 15:45:20] ERROR: Failed to deserialize response for get entities with ID=1234
Grepping or otherwise searching unstructured text causes you to miss relevant records while surfacing irrelevant ones that only muddy the picture.
Structured logging
What if you could search logs the same way you query a database with SQL?
{
    "timestamp": "2022-01-20 15:45:27",
    "severity": "error",
    "messageTemplate": "Failed to update entity with ID {entityId}: {exceptionMessage}.",
    "messageDisplay": "Failed to update entity with ID 1234: Database constraint violation - Duplicate entry '[email protected]' for key 'email_unique'.",
    "data": {
        "entityId": 1234,
        "exceptionMessage": "Database constraint violation - Duplicate entry '[email protected]' for key 'email_unique'"
    }
}
Now finding all errors for entity 1234 is a simple query (Elasticsearch example):
severity: error and data.entityId: 1234
Despite this, logging is commonly done like this:
public async Task<Pet> CreatePet(Pet pet)
{
	_logger.LogInformation($"Creating pet with name {pet.NickName}");

	// collapsed
}
or even:
logger.LogInformation($"Got response: {JsonSerializer.Serialize(response)}");
Both are bad practice — they produce flat records instead of structured data. Searching those logs requires full-text substring search (ECS query):
FullText: *some value*
This inherits all the problems of flat logs while adding unnecessary load on Elasticsearch.
The correct way:
_logger.LogInformation("Creating pet with name {NickName}", pet.NickName);
Do not interpolate strings when logging, and definitely don't serialize objects into the message.
Note: the placeholder name you use in the template is what gets used as the key in the structured data store (i.e., Elasticsearch). It does not have to match the variable/field/property name passed as the argument. Placeholders correlate with values by position, not by name.
EventId
OK, logs are written in structured form. But how do you find all logs from our imaginary application related to creating a pet? Search by message substring again? That's what EventId is for. Create a class to manage them from one place:
public static class ApplicationEventId
{
    public const int CreatePet = 1_000;
}
Now when creating a pet:
public async Task<Pet> CreatePet(Pet pet)
{
    logger.LogInformation(
        eventId: ApplicationEventId.CreatePet,
        message: "Creating pet with nickname({nickName})",
        args: pet.NickName
    );

    ...
}
This lets you search logs by EventId:
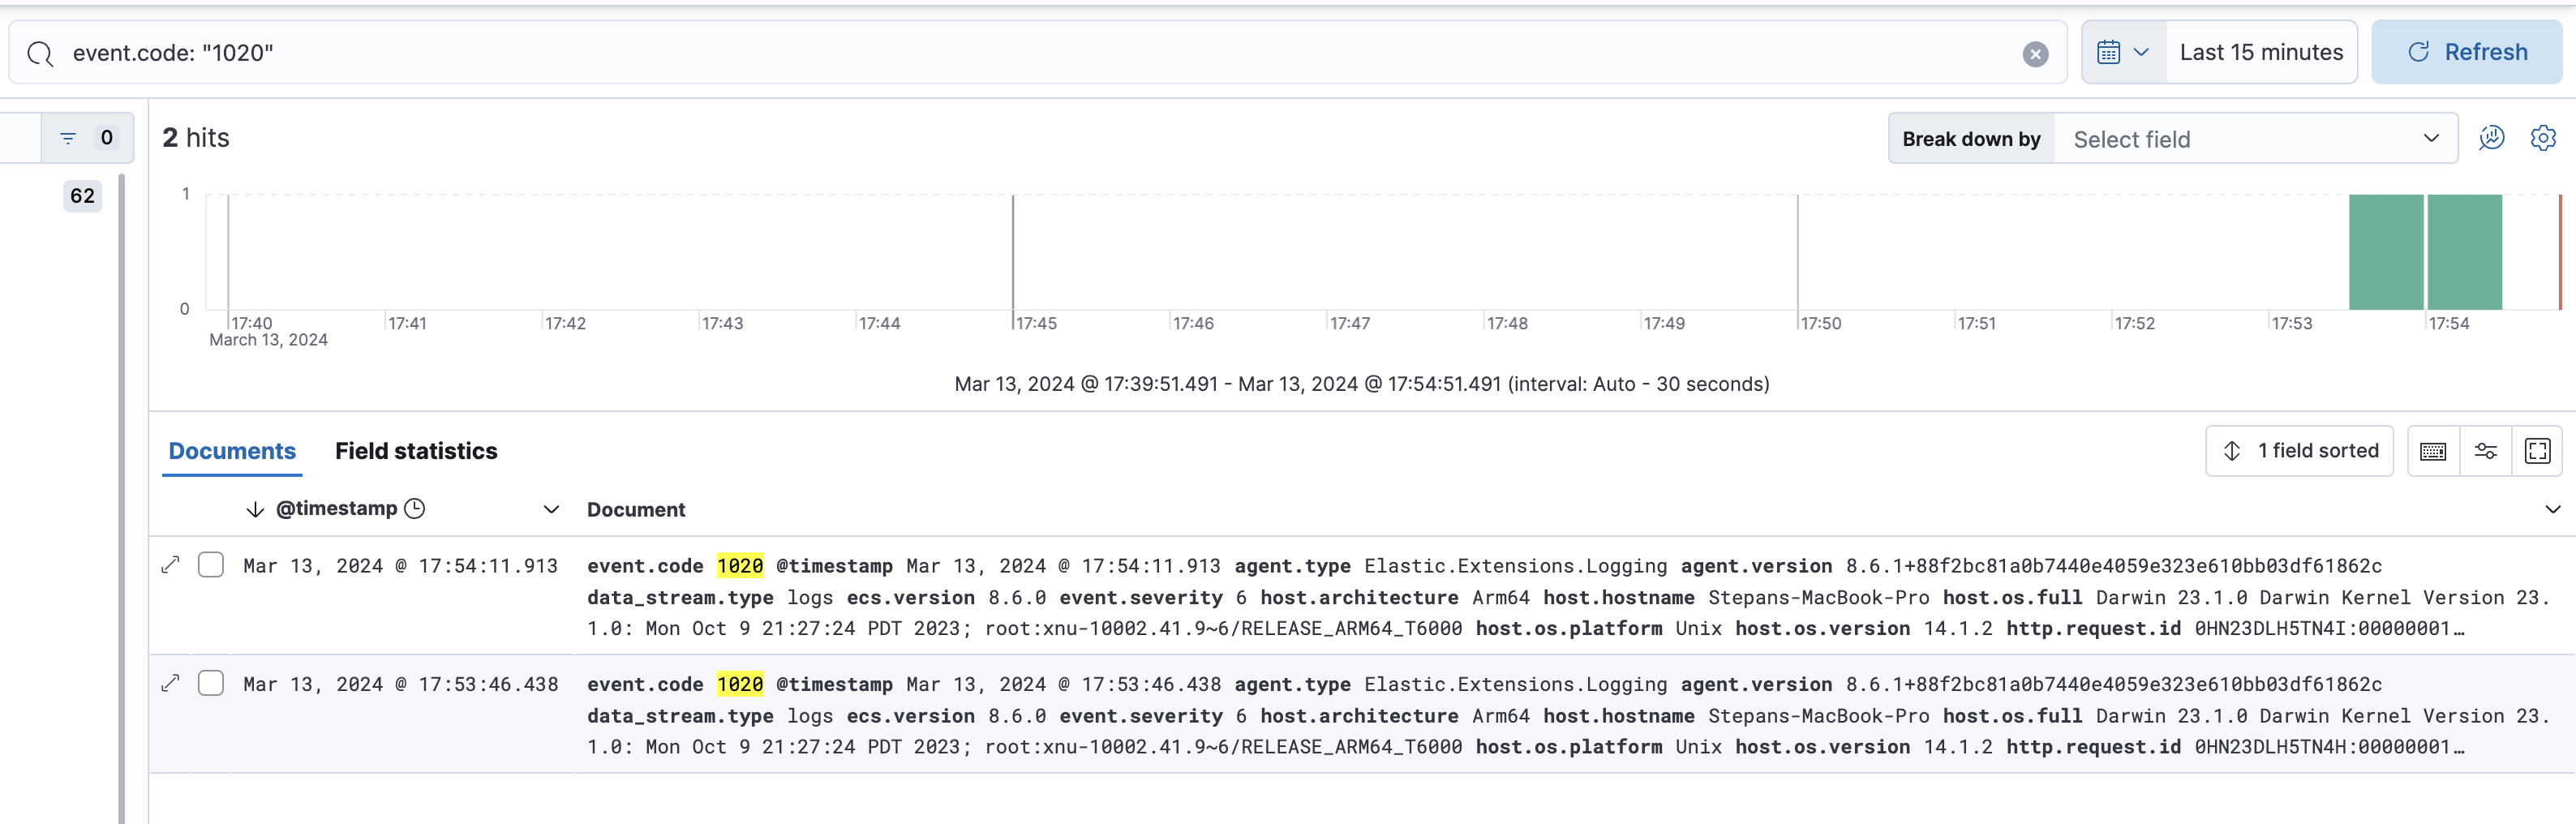
In Elastic.Extensions.Logging, EventId is recorded as: {EventId.Name}({EventId.Id})
Logging interfaces
Standard interface
logger.LogInformation(
    eventId: ApplicationEventId.CreatePet,
    message: "Creating pet with nickname({nickName})",
    args: pet.NickName
);
Source-generated loggers
Logging the standard way can clutter code significantly and hurt readability. Consider this caching service:
public class CacheService<TKey, TValue>
    : IDisposable
    where TKey : IEquatable<TKey>
    where TValue : class
{
    private sealed record CacheWrapper(DateTime ExpiresAt, TValue Value);

    private readonly ConcurrentDictionary<TKey, CacheWrapper> _cache = new();
    private readonly TimeSpan _timeToLive = TimeSpan.FromMinutes(10);
    private readonly TimeSpan _purgingInterval = TimeSpan.FromSeconds(10);
    private readonly Timer _timer;

    public CacheService()
    {
        _timer = new Timer(_purgingInterval);
        _timer.Elapsed += PurgeExpired;

        _timer.Start();
    }

    private void PurgeExpired(object? sender, ElapsedEventArgs e)
    {
        if (_cache.IsEmpty)
            return;

        var expiredKeys = _cache
            .Where(kv => kv.Value.ExpiresAt < DateTime.UtcNow)
            .Select(kv => kv.Key)
            .ToArray();

        foreach (var key in expiredKeys)
        {
            _cache.Remove(key, out _);
        }
    }

    public Task<TValue?> Get(TKey key, Func<TKey, Task<TValue?>> retrieve)
        => _cache.GetValueOrDefault(key) switch
        {
            { } cachedValue when cachedValue.ExpiresAt > DateTime.UtcNow => Task.FromResult<TValue?>(cachedValue.Value),
            null => GetAndSet(key, retrieve),
            _ => GetAndSetIfExpired(key, retrieve),
        };

    private async Task<TValue?> GetAndSet(TKey key, Func<TKey, Task<TValue?>> retrieve)
    {
        var value = await retrieve(key);

        if (value is null)
            return null;

        _cache.TryAdd(key, new CacheWrapper(DateTime.UtcNow + _timeToLive, value));

        return value;
    }

    private Task<TValue?> GetAndSetIfExpired(TKey key, Func<TKey, Task<TValue?>> retrieve)
    {
        _cache.Remove(key, out _);

        return GetAndSet(key, retrieve);
    }

    public void Dispose() => _timer.Dispose();
}
Adding logging to just one of those methods (left: original, right: with logs):
private async Task<TValue?> GetAndSet(TKey key, Func<TKey, Task<TValue?>> retrieve)
{
    var value = await retrieve(key);

    if (value is null)
        return null;

    _cache.TryAdd(key, new CacheWrapper(DateTime.UtcNow + _timeToLive, value));

    return value;
}

private async Task<TValue?> GetAndSet(TKey key, Func<TKey, Task<TValue?>> retrieve)
{
    _logger.LogDebug(
        InternalEventId.CacheValueMissed,
        "Missed cache value for key {key}",
        key
    );

    var value = await retrieve(key);

    if (value is null)
    {
        _logger.LogDebug(
            InternalEventId.CacheRetrievedNullActualValue,
            "Cache retrieved null actual value for key {key}",
            key
        );

        return null;
    }

    _cache.TryAdd(key, new CacheWrapper(DateTime.UtcNow + _timeToLive, value));

    _logger.LogDebug(
        InternalEventId.CacheReturnedActualValue,
        "Cache returned actual value {value} for key {key}",
        value,
        key
    );

    return value;
}
The small, compact method doubled in size and is no longer pleasant to read. You could put each log call on one line, but that only changes the direction of growth (vertical vs. horizontal).
.NET 8 introduced Compile-time logging source generation. Here's how it works for the first log message above:
internal static partial class CacheServiceLogger
{
    [LoggerMessage(
        EventId = InternalEventId.CacheValueMissed,
        Level = LogLevel.Debug,
        Message = "Missed cache value for key {key}"
    )]
    internal static partial void LogCacheMiss(this ILogger logger, object key);
}
You declare the same things as before, and the generator produces something like this:
    partial class CacheServiceLogger
    {
        [global::System.CodeDom.Compiler.GeneratedCodeAttribute("Microsoft.Extensions.Logging.Generators", "8.0.9.3103")]
        private static readonly global::System.Action<global::Microsoft.Extensions.Logging.ILogger, global::System.Object, global::System.Exception?> __LogCacheMissCallback =
            global::Microsoft.Extensions.Logging.LoggerMessage.Define<global::System.Object>(global::Microsoft.Extensions.Logging.LogLevel.Debug, new global::Microsoft.Extensions.Logging.EventId(2010, nameof(LogCacheMiss)), "Missed cache value for key {key}", new global::Microsoft.Extensions.Logging.LogDefineOptions() { SkipEnabledCheck = true });

        [global::System.CodeDom.Compiler.GeneratedCodeAttribute("Microsoft.Extensions.Logging.Generators", "8.0.9.3103")]
        internal static partial void LogCacheMiss(this global::Microsoft.Extensions.Logging.ILogger logger, global::System.Object key)
        {
            if (logger.IsEnabled(global::Microsoft.Extensions.Logging.LogLevel.Debug))
            {
                __LogCacheMissCallback(logger, key, null);
            }
        }
    }
In the method itself you now simply call: _logger.LogCacheMiss(key);
The result (left: source-generated logs, right: previous version):
private async Task<TValue?> GetAndSet(TKey key, Func<TKey, Task<TValue?>> retrieve)
{
    _logger.LogCacheMiss(key);

    var value = await retrieve(key);

    if (value is null)
    {
        _logger.LogCacheNullActualValue(key);
        return null;
    }

    _cache.TryAdd(key, new CacheWrapper(DateTime.UtcNow + _timeToLive, value));

    _logger.LogActualValue(value, key);

    return value;
}

private async Task<TValue?> GetAndSet(TKey key, Func<TKey, Task<TValue?>> retrieve)
{
    _logger.LogDebug(
        InternalEventId.CacheValueMissed,
        "Missed cache value for key {key}",
        key
    );

    var value = await retrieve(key);

    if (value is null)
    {
        _logger.LogDebug(
            InternalEventId.CacheRetrievedNullActualValue,
            "Cache retrieved null actual value for key {key}",
            key
        );

        return null;
    }

    _cache.TryAdd(key, new CacheWrapper(DateTime.UtcNow + _timeToLive, value));

    _logger.LogDebug(
        InternalEventId.CacheReturnedActualValue,
        "Cache returned actual value {value} for key {key}",
        value,
        key
    );

    return value;
}
Logging speed (BenchmarkDotnet):
| Method | Mean | Error | StdDev |
|---|---|---|---|
| NoLog | 0.0103 ns | 0.0015 ns | 0.0013 ns |
| StandardLog | 10,037.8848 ns | 199.7660 ns | 222.0394 ns |
| SourceGeneratedLog | 9,832.4832 ns | 196.4297 ns | 557.2383 ns |
| SuppressLog | 42.0594 ns | 0.5636 ns | 0.4706 ns |
Crank (bombardier):
| Bench name | First Request (ms) | Requests | Bad responses | Latency 50th (ms) | Latency 75th (ms) | Latency 90th (ms) | Latency 95th (ms) | Latency 99th (ms) | Mean latency (ms) | Max latency (ms) | Requests/sec | Requests/sec (max) | Read throughput (MB/s) |
|---|---|---|---|---|---|---|---|---|---|---|---|---|---|
| NoLog | 681 | 2,873,553 | 0 | 1.01 | 1.59 | 2.01 | 2.25 | 3.52 | 1.33 | 73.50 | 191,056 | 226,472 | 35.80 |
| StdLog | 675 | 133,919 | 0 | 29.45 | 33.71 | 38.27 | 42.16 | 52.63 | 28.69 | 156.17 | 9,079 | 51,009 | 1.67 |
| SourceGen | 684 | 133,178 | 0 | 29.54 | 34.23 | 39.23 | 42.97 | 52.21 | 28.85 | 125.06 | 8,990 | 67,469 | 1.66 |
| DefinedLog | 668 | 133,342 | 0 | 29.77 | 33.53 | 37.77 | 41.66 | 53.54 | 28.81 | 170.11 | 9,010 | 64,246 | 1.66 |
| SupressLog | 685 | 2,837,691 | 0 | 1.01 | 1.64 | 2.02 | 2.31 | 3.54 | 1.35 | 94.60 | 188,341 | 216,767 | 35.35 |
| Bench name | Requests | Mean latency (ms) | Requests/sec |
|---|---|---|---|
| NoLog | 2,873,553 | 1.33 | 191,056 |
| StdLog | 133,919 | 28.69 | 9,079 |
| SourceGen | 133,178 | 28.85 | 8,990 |
| DefinedLog | 133,342 | 28.81 | 9,010 |
| SupressLog | 2,837,691 | 1.35 | 188,341 |
Microsoft markets source-generated loggers as a high-performance solution, but as the benchmarks show, there's no meaningful speed difference between the approaches. Kirill Bazhaykin independently reached the same conclusion.
Structured logging via Elastic.Extensions.Logging
_logger.CreateEntry(LogLevel.Information, ApplicationEventId.CreatePet)
    .Message($"Creating pet with nickname({pet.NickName})")
    .Data(new { NickName = pet.NickName })
    .Write()
    ;
Nothing stops you from combining standard logging with this as a cleaner extension method:
public static void LogCreatePet(this ILogger<PetService> logger, string nickName) => logger
    .CreateEntry(LogLevel.Information, ApplicationEventId.CreatePet)
    .Message($"Creating pet with nickname({nickName})")
    .Data(new { NickName = nickName })
    .Write()
    ;
Console logging in production
Here's a benchmark comparing logging to console vs. logging to file (using NReco.Logging.File):
| Method | Mean | Error | StdDev | Median |
|---|---|---|---|---|
| Console | 232,008.7 ns | 3,605.41 ns | 3,372.50 ns | 231,885.4 ns |
| File | 650.7 ns | 23.81 ns | 70.22 ns | 619.7 ns |
Console logging is many times slower. That said, these are synthetic benchmark numbers — in a real application the first database or network call dwarfs the difference. Still, why log to console if it wastes resources for no reason?
Configuration
You can filter which logs get written based on level and category:
builder.Logging.AddFilter<ConsoleLoggerProvider>("Default", LogLevel.Critical);
builder.Logging.AddFilter<Elastic.Extensions.Logging.Provider>("Default", LogLevel.Information);
builder.Logging.AddFilter<Elastic.Extensions.Logging.Provider>("Microsoft", LogLevel.Warning);
builder.Logging.AddFilter<Elastic.Extensions.Logging.Provider>("Jaeger", LogLevel.Warning);
But those rules apply to all environments, and you'd want more verbosity on dev/staging. That leads to spaghetti like this:
if (builder.Environment.IsProduction())
{
    builder.Logging.AddFilter<ConsoleLoggerProvider>("Default", LogLevel.Critical);
    builder.Logging.AddFilter<Elastic.Extensions.Logging.Provider>("Default", LogLevel.Information);
    builder.Logging.AddFilter<Elastic.Extensions.Logging.Provider>("Microsoft", LogLevel.Warning);
    builder.Logging.AddFilter<Elastic.Extensions.Logging.Provider>("Jaeger", LogLevel.Warning);
}
else
{
    builder.Logging.AddFilter<ConsoleLoggerProvider>("Default", LogLevel.Information);
    builder.Logging.AddFilter<Elastic.Extensions.Logging.Provider>("Default", LogLevel.Information);
    builder.Logging.AddFilter<Elastic.Extensions.Logging.Provider>("Microsoft", LogLevel.Information);
    builder.Logging.AddFilter<Elastic.Extensions.Logging.Provider>("Jaeger", LogLevel.Warning);
}
But why write this in code when it's essentially config that can live in Consul, configured per environment and updated at runtime?
The proposed JSON configuration:
{
    "Logging": {
        "Console": {
            "LogLevel": {
                "Default": "Critical"
            }
        },
        "Elastic": {
            "Default": "Information",
            "Microsoft": "Warning",
            "Jaeger": "Warning"
        }
    }
}
Which translates to key-value pairs in Consul:
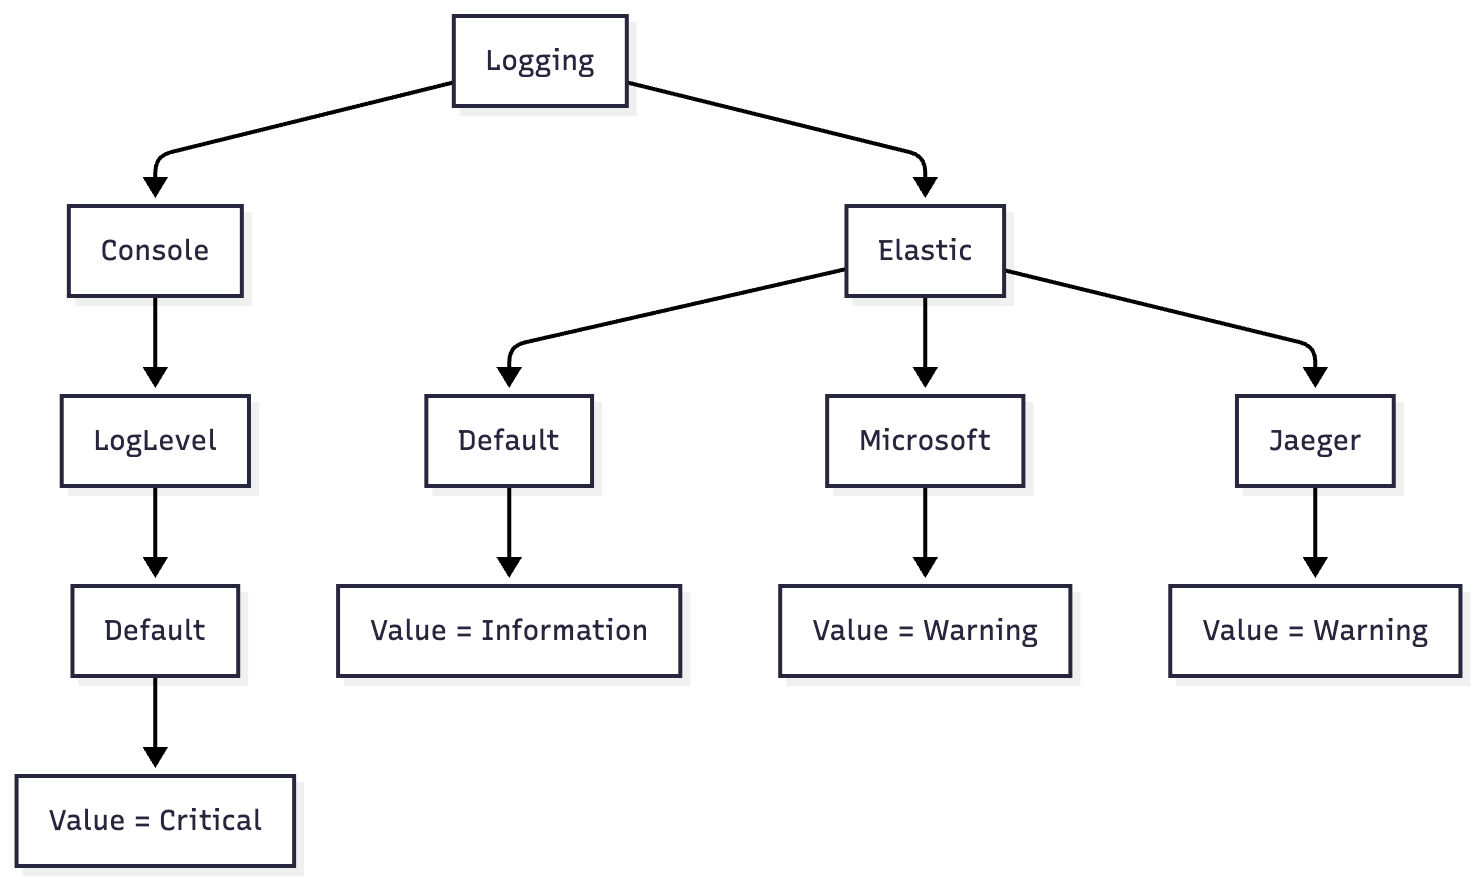
In this example, console output is suppressed in production (only Critical errors), while Elasticsearch receives everything at Information and above — except Microsoft and Jaeger namespaces, which only ship Warning and higher.
Conclusion
- Write logs — they help you and everyone else.
- Write them thoughtfully: clear messages with context, the right category, and the right level.
- Don't use string interpolation or
JsonSerializerin log calls — write structured logs. - In addition to setting log levels, configure filtering to suppress noise per environment.
- Handle errors properly — stop littering your code with useless try-catch blocks.